PHEV Real-World Range & Savings Calculator
Discover how ambient temperature, motorway cruising speed, cabin heating, and battery health impact your actual electric kilometers and charging savings.
Range Simulator & Calculator
Discover your real-world electric range, charging costs, and petrol savings based on driving conditions
External Temperature
Climate Control
Highway Share
Selected Vehicle
2025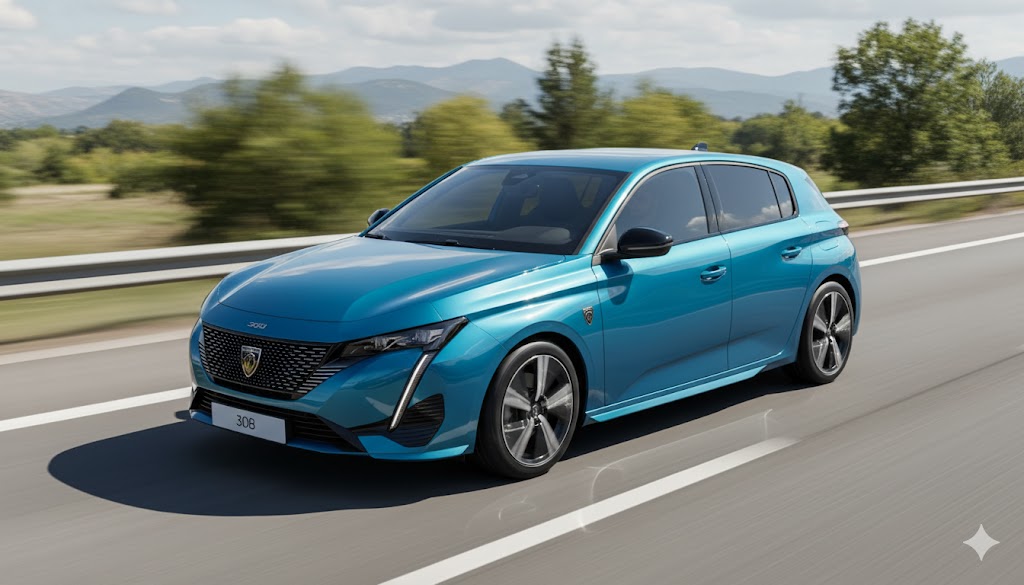
Peugeot 308
●Stable sub-zero winter discharge curve, high energy density.
●P2 Parallel: Long motorway overdrive ratio preserves high-speed efficiency.
How Range is Calculated
Your real-world electric range depends on ambient temperature, heating/AC usage, and highway speeds. Cold winter temperatures reduce battery capacity, while high speeds increase aerodynamic drag. This simulator uses vehicle-specific WLTP test data, aerodynamic drag modeling, and thermodynamic factors to deliver accurate real-world estimates.
Why Real-World PHEV Range Differs from WLTP
Official laboratory WLTP tests are conducted at a flat 23°C in climate-controlled test dynamometers. On European roads, physical forces dictate your true daily range.
Winter Temperatures & Electrolyte Viscosity
Below 0°C, liquid electrolytes thicken and high-voltage PTC heaters consume 2-4 kW, cutting cold-start pure electric range by 25% to 35%.
Aerodynamic Drag at 120-140 km/h
Air resistance scales quadratically with speed (Fd ∝ v²). Cruising at 140 km/h increases aerodynamic drag by ~35% compared to 100 km/h, reducing range.
Pre-Conditioning on Grid Power
Warming or cooling the cabin while connected to a wallbox draws energy from the home grid instead of the vehicle battery, recovering 15% to 20% range.
Used Car Battery State of Health (SOH)
A 3-4 year old vehicle typically retains 90% to 92% usable battery capacity. Model exact degradation before purchasing a second-hand plug-in hybrid.
Battery Chemistry & Transmission Architecture Dynamics
How LFP vs NMC cell chemistry and P2 e-DSG vs P1+P3 DHT drivetrains change real-world range.
LFP vs NMC Chemistry
LFP (Lithium Iron Phosphate) - BYD, Jaecoo, Chery
3,000+ CyclesExceptional 3,000+ cycle life with near-zero degradation over 4 years (94% retained SOH). Electrolyte thickens faster at sub-zero cold without pre-heating, but recovers up to 65% when pre-conditioned.
NMC (Nickel Manganese Cobalt) - VAG, BMW, Mercedes
High DensityHigher gravimetric energy density and stable sub-zero cold discharge down to -10°C. Standard 1,000-1,500 cycle lifespan with normal ~10% degradation over 3-4 years.
DHT vs P2 Architecture
P1+P3 DHT Super Hybrid (Jaecoo, Chery, BYD DM-i)
+12% Urban RegenDedicated Hybrid Transmission runs in direct electric or series mode without mechanical transmission friction, unlocking +12% higher regenerative recovery in urban stop-and-go.
P2 Parallel Architecture (VAG e-DSG, BMW ZF)
High-Speed GearElectric motor is integrated between engine and gearbox. Long overdrive mechanical ratios (6th-8th gear) maintain high efficiency at 130-140 km/h motorway cruising.
Frequently Asked Questions
Everything you need to know about plug-in hybrid electric range and daily charging.