The Engineering Behind the PHEVs.eu Route Simulator: Why It Is the Most Realistic Engine on the Web
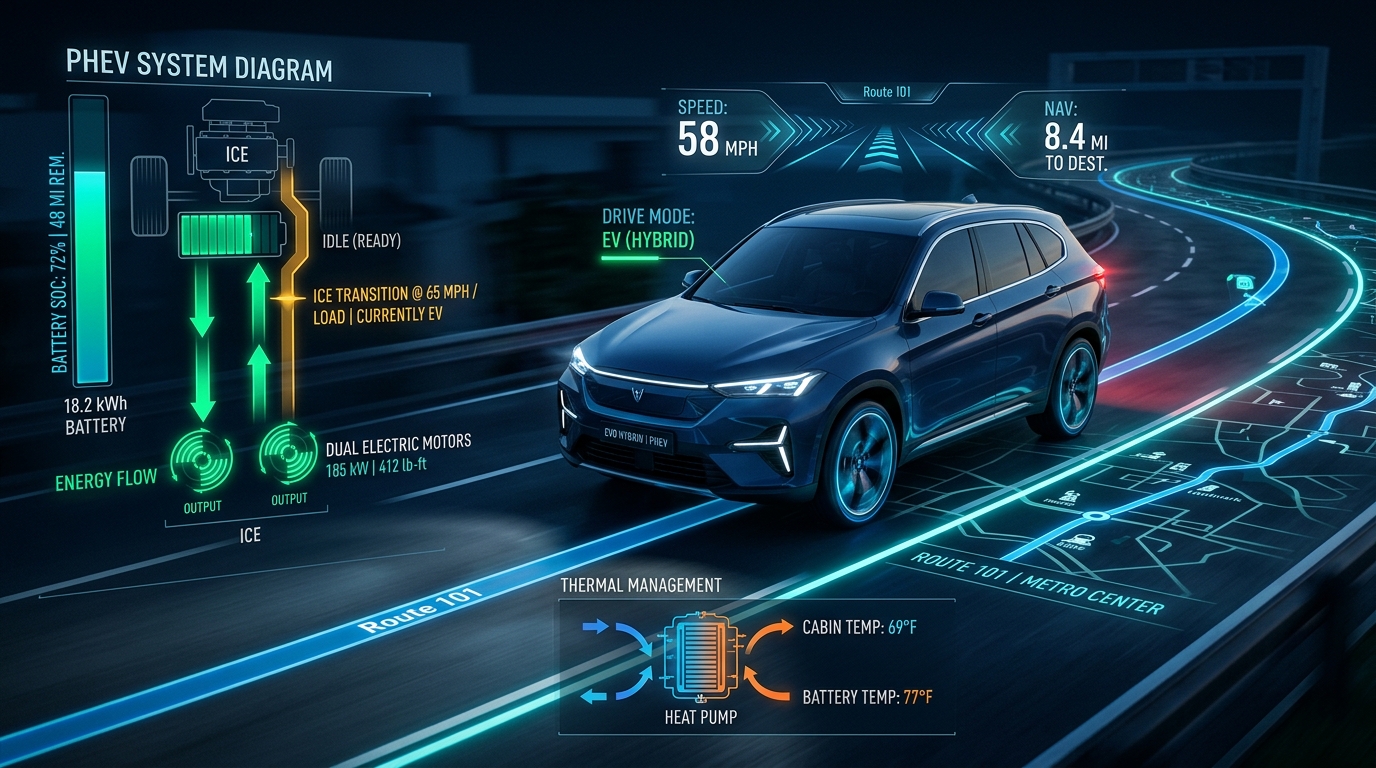
Beyond simplistic calculators: How we modeled OSRM route segmentation, P2 vs DHT transmission dynamics, max pure-EV speed thresholds, hybrid buffer reserves, and thermal heat pump physics into an engineering-grade simulator.
Plug-in Hybrids (PHEVs) are among the most technologically advanced and yet frequently misunderstood vehicles in the modern automotive landscape. On one hand, they offer high-voltage traction batteries (15–30 kWh) promising daily zero-emission commutes; on the other, they retain an internal combustion engine (ICE) eliminating any trace of range anxiety.
However, car buyers face an ongoing paradox: Why do factory WLTP catalog ratings deviate so substantially from real-world road trips?
Conventional online range calculators rely on basic school-level arithmetic:
$$\text{Range} = \frac{\text{Battery Capacity (kWh)}}{\text{Fixed Consumption (kWh/100km)}} \times 100$$
While this assumption is already crude for pure electric vehicles (BEVs), it is entirely invalid for plug-in hybrids—where dual powertrains, mechanical clutches, speed cut-offs, and state-of-charge buffers interact dynamically thousands of times per journey.
To solve this, the PHEVs.eu engineering team engineered the New Generation Route & Physics Range Simulator (Point A $\rightarrow$ Point B). In this technical deep dive, we explore why this engine stands as the most accurate simulation tool in Europe, revealing the mathematical formulas, drivetrain dynamics, and meteorological modeling behind it.
1. True Route Geometry & OSRM Road Segmentation
No real journey is a flat straight line. From leaving your garage to cruising on the motorway, your journey transitions across urban streets, orbital ring roads, and fast highway corridors.
Our simulator leverages the Open Source Routing Machine (OSRM) to deconstruct your exact driving route into micro-segments:
| Road Segment | Speed Limits | Power Demand Profile | Aerodynamic Drag Impact |
|---|---|---|---|
| Urban (< 50 km/h) | Stop-and-go city streets | Low average speed, high kinetic regenerative recovery (KERS) | Negligible |
| Suburban (50–90 km/h) | Flowing regional arteries | Balanced constant load, optimal EV motor efficiency | Moderate |
| Highway (> 90–140 km/h) | High-speed motorways | Continuous heavy electrical draw, zero regenerative braking | Dominant quadratic drag ($v^2$) |
Our physics engine evaluates energy consumption segment-by-segment. It recognizes that 10 km in stop-and-go city traffic consumes ~1.5 kWh, whereas the same 10 km at 130 km/h on a motorway demands ~3.1 kWh.
2. Aerodynamic Drag Dynamics: $F_d \propto v^2$
The physical law governing vehicle highway consumption is aerodynamic resistance:
$$F_d = \frac{1}{2} \rho \cdot v^2 \cdot C_d \cdot A$$
Even assuming air density ($\rho$), drag coefficient ($C_d$), and frontal area ($A$) are constant, velocity ($v$) squared magnifies aerodynamic drag dramatically:
- Cruising at 130 km/h increases aerodynamic resistance by +108% compared to 90 km/h.
- At 140 km/h, aerodynamic drag surges by +142%.
Our route engine dynamically scales electric consumption from an urban 15–17 kWh/100km up to 28–34 kWh/100km when cruising along highway waypoints.
3. Powertrain Architecture Dynamics: P2 Parallel vs. P1+P3 DHT
Not all PHEVs behave identically. The market is split into two contrasting engineering philosophies:
A. P2 Parallel Architecture (VAG e-DSG, BMW ZF 8-Speed, Mercedes 9G-TRONIC)
The electric motor sits directly between the combustion engine and a multi-gear transmission:
- Highway Strength: Mechanical overdrive ratios (6th, 7th, 8th gears) maintain low engine RPMs even when the battery is depleted, delivering superior fuel economy at 130 km/h.
- City Trade-off: Mechanical gearbox drag slightly penalizes urban pure electric efficiency.
B. P1+P3 Dedicated Hybrid Transmission (BYD DM-i, Jaecoo, Chery, Omoda)
Dedicated Hybrid Transmission (DHT) design:
- Uses a generator motor (P1) coupled to the engine and a powerful traction motor (P3) driving the axle directly.
- Operates as a series hybrid in urban and suburban driving; the combustion engine only connects directly to wheels via a lock-up clutch at cruising speeds.
- Unlocks +12% higher regenerative energy recovery in urban stop-and-go.
Our model database includes powertrain tags for each vehicle, tuning regeneration rates and high-speed mechanical overdrive parameters accordingly.
4. Pure EV Cruising Speed Ceiling (maxEvCruisingSpeed)
Many PHEV drivers are surprised to see their petrol engine kick in at 138 km/h even when their battery is 90% full.
This occurs because electric motor rotor speed (RPM) and back-EMF voltage limits prevent efficient electric propulsion at sustained autobahn speeds:
- Toyota RAV4 / Prius PHEV: Pure EV cruising ceiling is 135 km/h.
- Volkswagen Passat eHybrid / Skoda Superb iV: Pure EV ceiling is 140 km/h.
- Earlier generation PHEVs: Ceilings often range between 85 and 110 km/h.
When highway road segments exceed the vehicle's maxEvCruisingSpeed, our engine seamlessly switches the simulated drive mode to "BLENDED" or "HEV", accurately capturing fuel consumption.
5. Hybrid Threshold SoC Buffer & Engine Start Point
A PHEV never drains its high-voltage traction pack to 0%.
Automakers reserve a 15% to 25% lower buffer to protect lithium cells from deep-discharge degradation and preserve hybrid power reserves for passing maneuvers:
$$\text{Usable EV Energy} = \text{Usable Battery (kWh)} \times \left( \frac{\text{Departure SoC} - \text{Buffer SoC}}{100} \right)$$
For example, on a Skoda Superb iV with a 25.7 kWh battery and a 20% buffer, only 80% of net capacity is usable for pure electric driving.
Our simulator pinpoints the exact transition milestone on the interactive map:
"Transition Point: Km 84.2 — 20% SoC buffer reached; internal combustion engine engaged."
6. Battery Chemistry (LFP vs. NMC) & Heat Pump Thermodynamics
Ambient temperature directly alters electrolyte viscosity and internal cell resistance:
- LFP (Lithium Iron Phosphate - BYD Blade): Extraordinary 3,000+ cycle durability, but higher internal resistance below $0^\circ\text{C}$ unless pre-conditioned.
- NMC (Nickel Manganese Cobalt - VAG, BMW, Volvo): Stable low-temperature discharge down to $-15^\circ\text{C}$, normal ~10% degradation over 4 years.
Heat Pump vs. Standard PTC Resistance
Cabin heating without engine waste heat demands substantial energy:
- PTC Resistance Heaters: Consume 3,000–4,500 Watts continuously from the battery, slashing sub-zero range by up to 32%.
- Heat Pumps: Deliver a Coefficient of Performance (COP) > 2.5, capturing ambient energy and lowering winter range penalty to just 10%–12%.
Our engine identifies whether the selected car is equipped with a heat pump and models thermal penalties accordingly.
7. Meteorological Forecasting via Open-Meteo API
Road trips are frequently scheduled days in advance. A journey next Thursday morning at 08:00 may face $2^\circ\text{C}$ cold and rain, whereas current weather is a mild $16^\circ\text{C}$.
Our simulator integrates the Open-Meteo API:
- Live ambient conditions for immediate departures.
- 7-to-10 day hourly weather forecasts for morning, noon, evening, or night departures.
8. Door-to-Door Geocoding via Photon OSM
Using OpenStreetMap Photon geocoding, our engine resolves exact street addresses, house numbers, and localized diacritics, mapping true road distances rather than generic city-center estimates.
9. Visual Sharing Ecosystem & Telemetry Export
Once a simulation is complete, users gain access to comprehensive telemetry and sharing tools:
- Step-by-Step Telemetry Breakdown: Speed, mode, remaining SoC, kWh and liters per segment.
- 1-Click Text Summary: Pre-formatted emoji summary ready for WhatsApp, forums, and email.
- 📸 High-Resolution Infographic Card (PNG): Direct mobile sharing to WhatsApp/Instagram, or 1-click clipboard copy (Ctrl+V) for desktop apps.
- Persistent URL Parameters: Share exact simulation links with pre-loaded vehicles and route parameters.